University of Pittsburgh, Pittsburgh, PA
ABSTRACT
Increased skin temperature is a risk factor for pressure ulcers, and previous studies have shown that local skin cooling had a protective effect on ischemic tissue. However, no rationale was given for the selection of cooling rates. The objective of this study was to investigate RH following the application of 8 kPa of localized pressure and local cooling to 25°C for two cooling rates (-4°C/min and -.33°C/min). A repeated measures design was used with 11 adult subjects. The fast cooling rate significantly reduced the normalized peak blood flow, and both cooling rates significantly decreased the perfusion area. Our results suggested that local cooling protected the ischemic tissue through metabolic and myogenic mechanisms, and fast cooling might be more beneficial since it reduced the severity of tissue ischemia.
KEYWORDS
pressure ulcers; laser Doppler flowmetry (LDF); local cooling; spectral analysis
BACKGROUND
People with spinal cord injury are at high risk for developing pressure ulcers. With the decreased mobility and the impaired thermoregulation of the skin below injury level (1), skin temperature inevitably increases over time where in close contact with support surfaces. Increased skin temperature is one of the least explored risk factors. Previous animal and human studies both showed that skin local cooling had a protective effect of the tissue under localized pressure. Kokate et al. examined histological data of swine tissue following loading with the same localized pressure and different temperatures. They found that the lower the skin temperature, the less tissue damage in all tissue layers (2).
Our pilot study on young adults was the first noninvasive human study that investigated the effect of local cooling on tissue viability (3). We examined the effect by measuring the pressure induced reactive hyperemia in the skin over the sacrum. Reactive hyperemia is a normal physiological response following tissue ischemia, which is characterized by a rapid increase in skin blood flow (SBF) followed by a gradual decrease back to baseline levels. A previous study showed that SBF signals contain a range of frequency components, and each frequency band corresponds to different control mechanisms: metabolic (0.008-0.02 Hz), neurogenic (0.02-0.05 Hz), and myogenic (0.05-0.15 Hz) (4). In our pilot study, we discovered that local cooling to 25°C significantly decreased the reactive hyperemic response in the skin, and both the metabolic and myogenic responses contributed to this protective effect (3).
The effect of local cooling rate on the amount of protection from pressure-induced ischemia afforded by the cooling has not been determined. A previous study investigated the SBF response with two different cooling rates: fast cooling (-4°C/min) and slow cooling (-.33°C/min) (5). They found that with fast cooling there was less vasconstriction as compared with slow cooling. Since the metabolic rate of local cells depends on their surrounding temperature, with the same amount of reduced metabolic demand as slow cooling, fast cooling might allow more blood flow supply to the compressed tissues and therefore increase the tissue tolerance to ischemia.
The objective of this study was to test the effectiveness of local fast and slow cooling rates on enhancing tissue viability under consistent externally applied pressure in adults at very low risk of developing pressure ulcers. The outcomes will aid in the development of a methodology to test the effect of local cooling rates in those with increased risk for pressure ulcers.
METHODS
Subject and Research Design
Eleven (six male, five female) adult human subjects (33.2 ± 11.9 years (mean value ± standard deviation)) participated in this study. They were not smokers and had no history of cardiopulmonary disease, vascular disease, hypertension or diabetes. They also did not take any medication or eat food/drink that may affect the cardiovascular system 12 hours prior to the study. The research protocol was approved by the University of Pittsburgh Institutional Review Board.
The subjects lay prone on a mat table, and the experiment was performed on the skin in the sacrum area (Figure 1(a)). This study used a repeated measures design with three test sessions: pressure only, pressure with slow cooling, and pressure with fast cooling. The pressure application phase (Figure 1(b)) was the same for all three test sessions and consisted of: 0.4kPa (3mmHg) for 5 minutes, 8kPa (60mmHg) for 20 minutes, and 0.4kPa for 15 minutes. For the test sessions with local cooling application, local cooling was applied through the pressure applicator to 25°C during the period of 8kPa pressure at two different rates: fast cooling (-4°C/min) and slow cooling (-.33°C/min).
Instrumentation and Data Analysis
An integrated test system was used to simultaneously apply localized pressure, control cooling and measure the SBF throughout the test. Proportional–integral–derivative (PID) controllers were used to maintain the localized pressure and cooling applied to the subject. Details of the instrumentation were previously published (3). Laser Doppler flowmetry was used to collect the SBF signal, and the SBF during reactive hyperemia was the main outcome measurement. The applied pressure, skin temperature, and SBF data were collected with a sampling frequency of 0.5Hz. SBF during reactive hyperemia is characterized as an increase in SBF immediately following the release of pressure causing tissue ischemia (during the last pressure application phase). Before determining parameters of the reactive hyperemia, the SBF signal was filtered using a 10th order Chebyshev I low pass filter, with a cutoff frequency of 0.15Hz.
The outcome measures of the SBF contain two parts: five time-domain parameters of the reactive hyperemic response and the spectral density of each frequency band of the perfusion signal. The time-domain parameters are: baseline SBF, peak SBF, normalized peak SBF, time to peak SBF, and perfusion area. Baseline SBF is the average value of SBF collected before 8kPa pressure application, peak SBF is the spike in SBF right after pressure relief, normalized peak is the peak value normalized by the baseline, time to peak is the time period from pressure relief to peak SBF, and perfusion area is the area between the SBF curve after pressure relief and the mean baseline SBF.
Spectrograms (magnitude-square of the short-time Fourier transform) were computed to estimate the time-varying spectral density of the SBF signal (equation 1). We used a 256 sample Hanning function for the window h(t), which corresponds to window duration of 512 seconds. For statistical purposes, the spectrogram of each frequency band was integrated over five time intervals: 1) the five minutes prior to 8 kPa pressure application, 2) the first five minutes, 3) the second five minutes, 4) and the third five minutes after 8 kPa pressure removal. The integrated spectrograms were normalized to the baseline value (equation 2).
For statistical analysis, a one-way repeated measures ANOVA was used to compare the time domain parameters, and a two-way repeated measures ANOVA was used to compare the spectral densities of each frequency band over time and among test sessions. P<0.05 was recognize as significant. For pair-wise comparisons, based on Bonferroni correction, p<0.016 was recognized as significant.
RESULTS
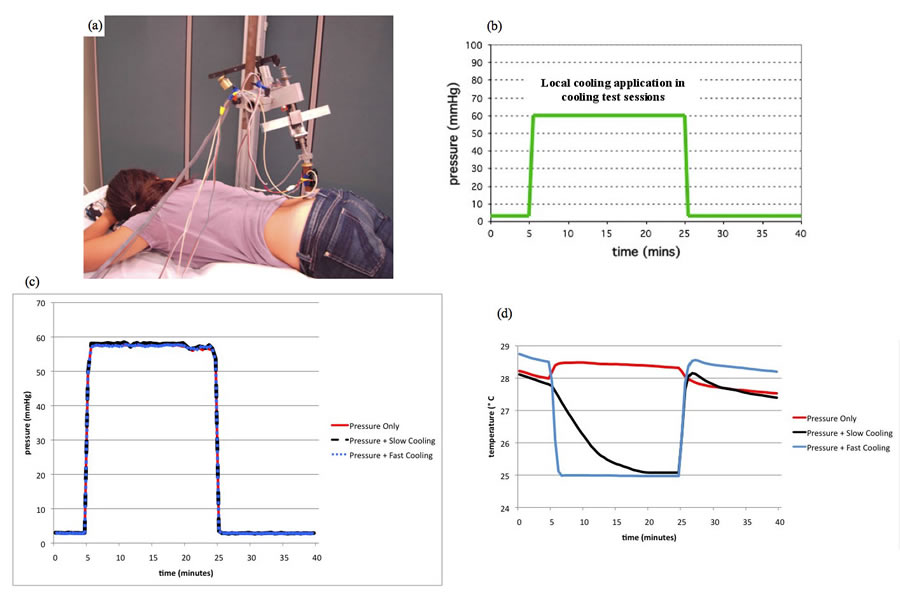 Figure 1: Test Setup, Applied Pressure, and Measured Skin Temperature
Figure 1(c) is the average pressure of all 11 subjects for the three test sessions. The applied pressures in all three sessions were almost identical. Figure 1(d) is the averaged skin temperature of all subjects for the three test sessions. The skin temperature decreased at two different rates in slow and fast cooling, and the skin temperature was maintained at 25°C as soon as the target temperature was reached in both test sessions.
Parameters |
Mean ± one standard deviation |
p |
||
|---|---|---|---|---|
Pressure Only |
Pressure + Slow |
Pressure + Fast |
||
Baseline SBF (au) |
5.8 ± 2.3 |
6.0 ± 2.1 |
6.5 ± 2.4 |
0.662 |
Peak SBF (au) |
13.0 ± 3.4 |
10.8 ± 5.1 |
8.8 ± 4.0 |
0.094 |
Normalized peak SBF (%) |
168.7 ± 139.3 |
88.6 ± 70.0 |
44.1 ± 61.3 |
0.011* |
Time to peak SBF (sec) |
75.1 ± 48.6 |
81.1 ± 64.8 |
74.4 ± 52.7 |
0.960 |
Perfusion area (103 au*sec) |
129.9 ± 124.3 |
15.7 ± 25.2 |
6.1 ± 12.9 |
0.008* |
Table 1 shows the data and the statistical results of the time-domain parameters of the reactive hyperemia. There were significant differences in normalized peak SBF and perfusion area, but not the other parameters. Pair-wise comparison showed that the normalized peak SBF in fast cooling is significantly lower as compared with pressure only (p=0.002), and no significant difference was found between slow cooling and pressure only (p=0.021). Pair-wise comparison also showed that the perfusion area in pressure only is significantly larger as compared with slow (p=0.011) and fast cooling (p=0.009). However, a significant difference in perfusion area between slow and fast cooling rates was not found (p=0.306).
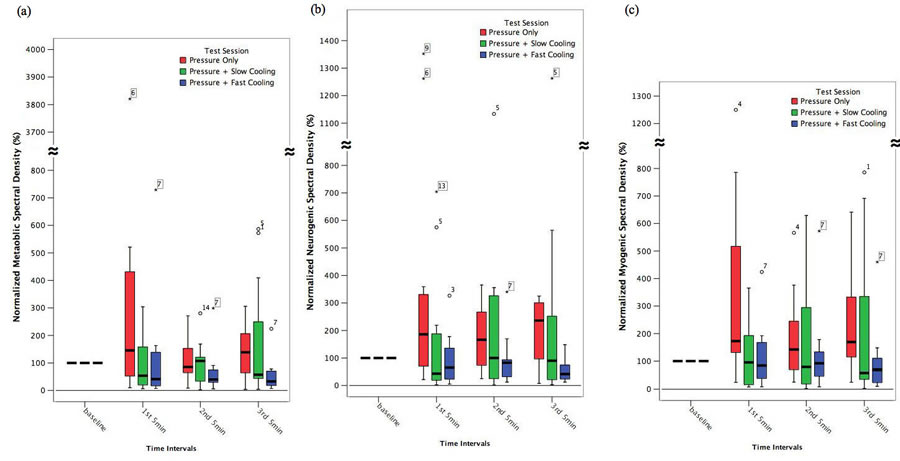 Figure 2: Normalized Spectral Density
Figure 2(a), (b) and (c) are the box plots of the normalized spectral density in metabolic, neurogenic, and myogenic frequency bands, respectively. In general, the spectral density of test session “pressure only” increased during the first five minutes after pressure removal and returned to the baseline value in all three frequency bands. The spectral density of both slow and fast cooling did not show a noticeable change over time in all three frequency bands. Repeated measures ANOVA showed that only the normalized myogenic spectral density had a significant change over time (p=0.023). Pair-wise comparison revealed that the changes in myogenic spectral density over time are most evident in the pressure only test session (baseline vs. 1st five minutes: p=0.045, 1st five vs. 2nd five minutes: p=0.054, and 2nd vs. 3rd five minutes: p=0.042). However, the differences between each time interval did not reach statistical significance.
DISCUSSION
The results of the applied pressure and skin temperature data suggested that our integrated system was capable of rapid and precise control of the pressure applied on the skin and, at the same time, cooling the skin to 25°C at two different rates.
The time-domain parameters of the reactive hyperemia have been used in a previous study to characterize the reactive hyperemia (6). Normalized peak SBF represents the amount of vascular response after tissue ischemia, and it denotes the severity of the tissue ischemia. Time to peak SBF shows how fast vessels respond to the release of ischemia, and the perfusion area represents the metabolic repayment of the tissue. The significant decrease in normalized peak SBF suggested that fast cooling significantly reduced the severity of ischemia under localized pressure, whereas this was not the case with slow cooling. The results from fast cooling were consistent with our pilot study on young adults, in which the skin was cooled to 25°C within one minute (3). The significant decrease due to fast cooling, however not slow cooling, might be due to less vasoconstriction during fast cooling, as hypothesized. This may also be because the ischemic tissue experienced a longer period of time at 25°C in fast cooling than in slow cooling. The significantly reduced perfusion areas in slow and fast cooling indicated that both cooling rates were able to reduce the tissue metabolic demand during ischemia.
Previous studies have shown that metabolic spectral density was related to the release of endothelial-origin vasodilator, and neurogenic and myogenic spectral densities were related to systematic and local vasomotion control mechanisms, respectively (4). The lack of changes in the myogenic spectral density overtime in fast and slow cooling suggested that both fast and slow cooling suppressed the smooth muscle activities, therefore decreasing the reactive hyperemic response.
Limitations
This was a pilot study that investigated the effectiveness of different cooling rates on the weight-bearing sacral tissue on adult human subjects at low risk for pressure ulcers. The results cannot be generalized to populations at high risk of pressure ulcers, e.g. people with spinal cord injury.
CONCLUSION
This is the first study to test the effect of different cooling rates on pressure induced reactive hyperemia in human subjects. Our results showed that both fast and slow cooling provided a protective effect on ischemic tissue by decreasing the metabolic demand and suppressing the smooth muscle activity. Our results also suggested that fast cooling might be more beneficial than slow cooling since fast cooling reduced the severity of adverse effects of tissue ischemia. This research protocol will be performed on people with spinal cord injury to further investigate the response in a population at high risk of pressure ulcer development. Findings from this study will guide future design in seat cushions featuring enhanced tissue tolerance to pressure.
REFERNCES
- Bogie, K. & Bader, D.L. (2005). Susceptibility of spinal cord-injured individuals to pressure ulcers. In Pressure Ulcer Research (pp.73-88). Berlin: Springer-Verlag.
- Kokate, J.Y., et al. (1995). Temperature-modulated pressure ulcers: a porcine model. Arch Phys Med Rehabil, 76, 666-73.
- Tzen, Y. (2008). Effects of local cooling on skin perfusion response to pressure: implications to pressure ulcer prevention. University of Pittsburgh Electronic Dissertation Database, 2008.
- Bracic, M. & Stefanovska, A. (1998). Wavelet-based analysis of human blood flow dynmics. B Math Biol, 60, 919-35.
- Yamazaki, F. et al. (2006). Rate dependency and role of nitric oxide in the vascular response to direct cooling in human skin. J Appl Physiol, 100, 42-50.
- Hagasawa, S., Ferguson-Pell, M., Cardi, M., & Miller, D. (1994). Assessment of skin blood contetnt and oxygenation in spinal cord injured subjects during reactive hyperemia. J Rehab Res Dev, 31, 1-14.
ACKNOWLEGEMENTS
The authors would like to thank Erik Porach for technical support of the test instruments, and all participants of this project. This work was funded by the National Institute on Disability and Rehabilitation Research (NIDRR), Rehabilitation Engineering Research Center (RERC) on Spinal Cord Injury, Grant #H133E070024. The ideas and opinions expressed herein are those of the authors and not necessarily reflective of the NIDRR.
Author Contact Information
Yi-Ting Tzen, MS, University of Pittsburgh, 6425 Penn Ave, Suite 401, Pittsburgh, PA 15206, Office Phone (412) 624-6433, EMAIL: yit10@pitt.edu
Word Version PDF Version